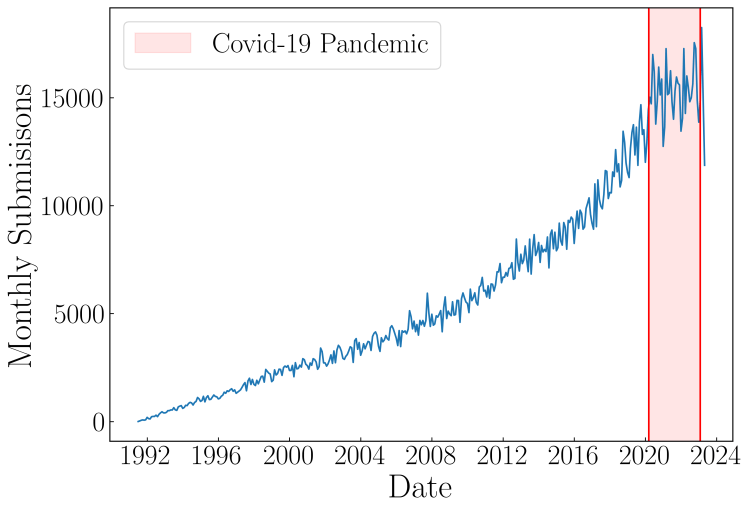
The growth of arxiv
Arxiv is a preprint server hosted by Cornell University. It is the main source for freely available science articles, especially in the field of astronomy but also more broadly. Since its founding in 1991, it has undergone tremendous growth. Fortunately, a census of the papers summited to arxiv every month is available here.
We can see that the number of preprints submitted has grown steadily over the past 20 years, except for a brief pause during the Covid-19 pandemic.
Looking at this plot there seems to be a weak periodic signal in addition to the longer-term trend. This suggests some seasonality. To get at this signal, we can plot consecutive years individually, scaling them relative to the average rate of submissions for that year.
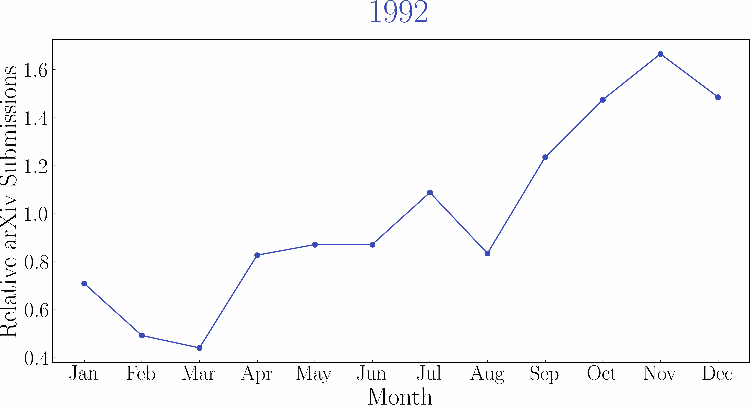
There are a few interesting features here. Most notably a dip in submissions around August seems to be common throughout most years. However, there is also a significant trend towards higher submissions in later months. In other words, the rate of submissions increases so quickly, that even normalizing in this way the overall growth trend is still visible.
To combat this, we can normalize our data by fitting lines to each individual year and subtracting off the trend. When this is done the following is produced:
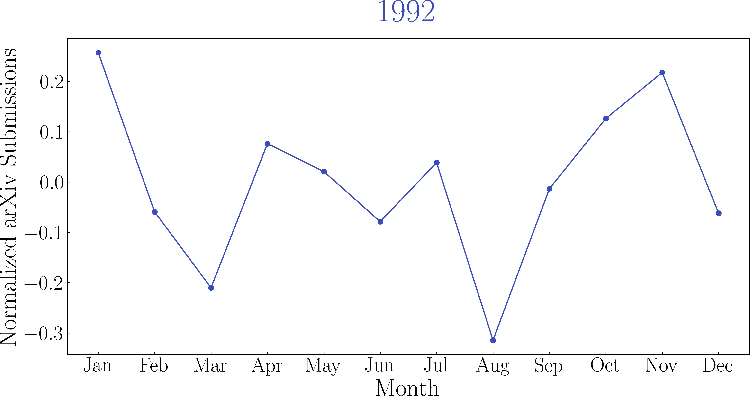
Now the seasonality is clearly visible. There is a significant dip in the rate of submissions each August, right before the beginning of the academic semester in most of the United States. Afterward, submissions slowly increase as the semester goes on, falling back to normal by Christmas. In the spring semester, there is more variability with a slight peak in March and relatively steady levels of submissions out towards July.
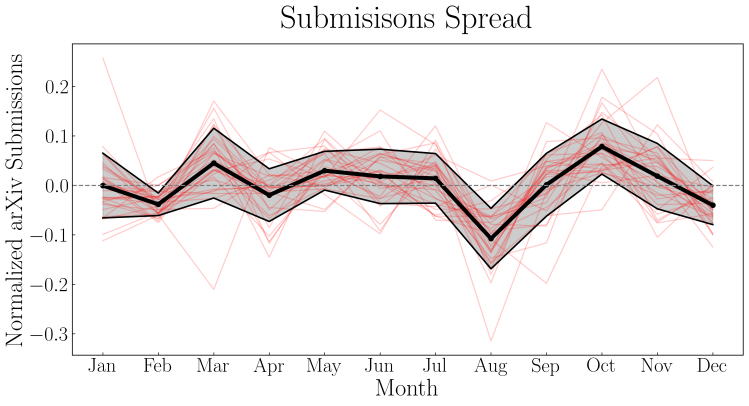
Since we have several years of data, we can meaningfully place confidence bounds on the normalized rate of submissions per month.
Github Link to Code: https://github.com/r-zachary-murray/archive/tree/master/Arxiv_Submission_Seasonality
